THIRD UPDATE
(Scroll down for the Second and First updates followed by the actual post that started a Twitter storm)
This afternoon, I received an e-mail informing me that because of my racist tendencies I was being removed as a member of the TBATS. I can only assume that this is because I think poverty and single parent homes are more of a factor in the behavior of students who are suspended from school than racism.
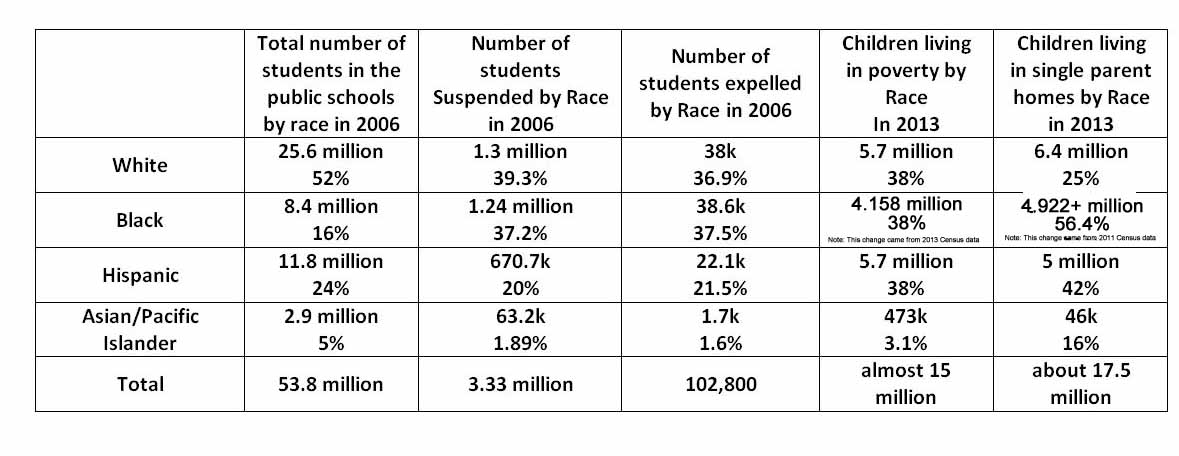
Therefore, this update includes a new chart with more information. Using the information in this chart, we will attempt to compare the ratio of White children living in poverty and single parent homes to see if the suspensions of Blacks, Hispanics and Asian/Pacific Islander students was equal or close to the ratio of White students who were suspended.

- Using 22.3% of total white students living in poverty and 5.1% of total white students who were suspended as the base, then 49.5% of Black students living in poverty is 2.2 times the number of White students. This equals 11.22% of 8.4 million. If racism was a factor in the additional 3.58% of Black student who were suspended, then 300,720 Black students might have been suspended due to racist tendencies leaving 74.9% of the total students suspended due to factors that might have been related to growing up in poverty and/or single parent homes.
- Using 25% of total White students living in single family homes and 5.1% of students who were suspended as the base, then 58.57% of Black students living in single parent homes is 2.34 times the number of White students or 11.9% instead of 14.8% of black students suspended offering evidence that racism might have been a factor in 2.9% of the suspensions of Black students. If true, then 240,400 Black students might have been suspended due to racist tendencies leaving 83.3% of the total students suspended that might have been related to growing up in poverty and/or single parent homes.
- The ratio of Hispanic students who live in poverty is 2.15 times the number of White students and that ratio is equal to 10.97% instead of the 5.8% who were suspended offering no evidence that racism was a factor in the suspension of Hispanic students.
- The ratio of Hispanic students who live in single family homes is 1.7 times the number of White students and this ratio is equal to 8.64% instead of the 5.8% of Hispanic students who were suspended offering no evidence that racism was a factor in the suspensions of Hispanic students.
- The ratio of Asian/Pacific Islander students who live in poverty is 0.73 times the White students who live in poverty and this ratio is equal to 3.72% instead of the 2.2% of total Asian/Pacific Islander students who were suspended offering no evidence that racism was a factor in the suspensions of Asian/Pacific Islander students.
- The ratio of Asian/Pacific Islander students who live in single parent homes was 0.4 times the White students and this ratio was equal to 2.42% instead of the 2.2% who were suspended offering no evidence that racism was a factor in the suspensions of Asian/Pacific Islander students.
In conclusion, poverty and growing up in single family homes is a much larger factor in the number of student suspensions than racism, and a transparent, public school, national, early childhood education program starting as early as age two might have a large impact that will eventually reduce poverty and increase literacy and life-long learning skills in children who grow up in poverty and/or single parent homes. Racism is another issue and other methods will be necessary to deal with this challenge. I don’t think early childhood education will have much of an impact in reducing racism.
SECOND UPDATE
Because I asked this question in my post there was an explosion on Twitter taking me to task for not focusing on racism and not admitting that it was a problem.
In the original post I wrote, “When 6.1% of the total students are suspended from public schools—or less as you will see—is that cause for a national crises and is it evidence of alleged racism?” … Later in the post, I also said, “Some critics have even alleged that the ratio of Black children being suspended is a sign of racism. I disagree, but you will have to make up your own mind after you look at all the numbers and in this post there are a lot of numbers to wrap your critical thinking around.”
Here is my response to one of the reactions that arrived as an e-mail. Too bad they couldn’t have left a comment here so we could have talked it over and explored the issue here where others could follow along.
My reply, I can see that racism is a topic you are passionate about. I think you even prove my point with your examples. We can’t stop racism, but we can help children who live in poverty and/or who grow up in single parent homes by implementing a public school managed national early childhood education program so those children grow up with the tools that will help them escape poverty and combat racism without anger and a sense of helplessness.
That’s why I refuse to allow the focus of my post to be hijacked by people obsessed with racism. …
What do you propose we do to stop racism—-send out mobs of vigilantes to hang anyone we suspect of racist tendencies?
I think the strongest weapon we can give victims of racism is literacy and an education and a good start, our best chance, would be a transparent publicly managed national early childhood education program that is not managed by corporations, because the evidence is strong that corporate Charters are racist because they encourage segregation and mostly refuse to work with the children who suffer the most from racism—at-risk children who grow up in poverty and/or single parent homes.
We can stay angry at racists, or we can eventually defeat racism by doing something about childhood poverty by intervening in the development of children as young as age two. They did it in France more than thirty years ago and poverty has dropped more than 50% since.
FIRST UPDATE
It came to my attention this morning (1-7-2015) that this post was severely criticized and attacked by some of the members of a site (TBATS) that recommended the post to their members—TBATS has deleted the recommendation and apologized to those who complained. The reason for this is because one paragraph in this post quoted information for one post at the conservative Heritage Foundation.
I want to make it clear that the numbers used in the chart did not come from the Heritage Foundation. They came from other sources, and I made the mistake of listing those sources further down in the post—and for that confusion, I apologize but for nothing else. I think this post was unfairly criticized. I have now moved those links, and they may be found right below the chart.
The only information quoted from the Heritage Foundation was the quote in that one paragraph about “children raised in single-parent homes are more likely to have emotional and behavioral problems; be physically abused; smoke, drink, and use drugs; be aggressive; engage in violent, delinquent, and criminal behavior; have poor school performance; and drop out of high school.” Nowhere in that quote was race mentioned.
However, because of the criticism of my post based on that one quote in one paragraph from the Heritage Foundation—a foundation that has been linked to ALEX and support from the Koch brothers and Bill Gates—that had nothing to do with the data in the chart, I decided to go directly to the U.S. Census.gov to verify some of the data that I used in the chart and made two revisions where—if you visit the actual Census data—you will discover that the total number of Black or African American family households was (in Table 1) 8,726,419, and that 836,460 single family households were are led by a male, while 4,085,938 were led by female householders for a total of 4,922,398 or 56.4% of the total number of Black and African American households in 2011. I have corrected the chart to show 56.4% instead of the 67% quoted from a 2013 source—that was not the Heritage Foundation. In addition, about 43.6% of Black or African American family households were led by married couples.
I then turned directly to the U.S. Census for info about poverty by race and found this data from 2013. In 2013, 38% (4.158 million) of Black or African-American children under 18 years lived in families below poverty. I used the data for Black Alone on page 53, Table B-2. The previous number that was quoted in my chart from another 2013 source was much lower.
I have also included in this update the orignal source the Heritage Foundation quoted from in their post from a scholarly study out of Western Michigan University in December 2011: Academic Achievement of Children in Single Parent Homes: A Critical Review
Here is the actual pull quote from the conclusion of the study that the Heritage Foundation quoted in their piece:
“A large body of research has documented the disadvantages of children raised in single-parent homes relative to children raised in two-parent homes. Lower high school graduation rates, lower GPAs, and greater risk for drug abuse are only some of the negative outcomes associated with growing up in a single-parent home. … This paper has been a review and critique of research from the past few decades regarding single parenthood. While the economic and social costs of single parenthood have been well documented, the strengths of single parents and their children have been largely overlooked.”
I think we might be able to learn something from this—that just because information comes from a conservative source doesn’t mean that information is wrong. Just like we sometimes have to follow the money, we also have to go to the original source.
THE ORIGINAL POST STARTS NEXT
In 2006, the U.S. public schools suspended students 3.3 million times. Note that I did not say 3.3 million students, because that might be misleading as you will see if you keep reading.
There is currently a group in the United States demanding that teachers and schools be restricted when it comes to suspending children from classrooms and schools. It would be interesting to know who is funding this issue and pushing it. Is it Arne Duncan who is the Secretary of the federal Department of Education or is it Bill Gates who is funding the push for Common Core standardized testing with $5 – $7 billion—test results that will be used to rank and fire teachers in addition to close public schools and turn our children over to corporations to teach even if parents don’t want that?
Corporate education reformers love throwing around numbers like 3.3 million, because that will make the public schools look really bad, and big numbers tossed out like that look so impressive to people who are easy to fool.
I decided to dig deeper to understand what that number really means.
In this post, we will explore what is behind the suspension and expulsion rates in the United States, because the public schools have been criticized for suspending too many students. Some critics have even alleged that the ratio of Black children being suspended is a sign of racism. I disagree, but you will have to make up your own mind after you look at all the numbers and in this post there are a lot of numbers to wrap your critical thinking around. The followinSome critics have even alleged that the ratio of Black children being suspended is a sign of racism.g chart provides a powerful and revealing comparison and I’m interested in your conclusions from this data.
- Table 169, at this National Center for Educational Statistics.gov link lists the “Number of students suspended and expelled from public elementary and secondary schools, by sex, race/ethnicity, and state: 2006”.
- The ratio of children living in single family homes by race may be found through this link at Kids Count data center.org
- Poverty ratios came from this link at Kids Count data center.org.
- The total number of children in public schools by race came from this link at The National Center for Education Statistics
Heritage.org says “Seventy-one percent of poor families with children are headed by single parents, mostly single mothers. Compared to children raised in an intact family, children raised in single-parent homes are more likely to have emotional and behavioral problems; be physically abused; smoke, drink, and use drugs; be aggressive; engage in violent, delinquent, and criminal behavior; have poor school performance; and drop out of high school.” The Heritage Foundation reports that in the United States, marriage drops the probability of child poverty by 82 percent.
In 2006, there were 53.8 million children in the k – 12 public schools, and there were 3.3 million suspensions representing 6.1% of the total number of students. That means almost 94% (or more) of the children did not earn a suspension. Census.gov
When 6.1% of the total students are suspended from public schools—or less as you will see—is that cause for a national crises and is it evidence of alleged racism?
There were 98,793 public schools in the United States in 2006-07. National Center for Education Statistics.gov
If we average that 3.3 million suspensions per school, it means each school suspended an average of about 33.4 students during the 2006 school year, and a school year has about 180 instructional days—I suspect the ratio is higher for schools with higher levels of childhood poverty and there is a reason for that, and it isn’t unique to the United States as you will see if you keep reading.
If we take that per-school average of 33.4 suspensions, it equals one student is suspended on average every 5.4 days for each school—but was it always a different student or were there repeat offenders as I strongly suspect based on my 30 years of experience as a public school teacher.
When I say repeat, I mean the same student being suspended more than once during one school year, and some of those chronic offenders eventually end up with an expulsion hearing.
For instance, at the high school where I taught from 1989 to 2005 there was a 70% childhood poverty rate at the time (it’s higher today) based on free and/or reduced lunch, and 92% of the students were non-white. The teacher—we called him Mr. D—who ran the in-house suspension system—a separate classroom on campus where students were required to do worksheets (the students were not allowed to just sit and visit. If they didn’t do the academic worksheets, they’d end up returning the next day for another period suspension), said that about 5% of the students at the high school earned 95% of the average 20,000 annual referrals that teachers wrote. At the time, Nogales High School had a student population of about 2,600. Five percent equals 130 students who earned 95% of the 20,000 referrals written by teachers each year. That works out to 146 referrals for each one of those 130 students, and yes, we had students who earned referrals from more than one of their teachers on a daily basis. Some students would earn six referrals a day—one for each class—day after day and if the teacher didn’t write the referral and send the student to Mr. D in the in-house suspension center for a class suspension, that student would often disrupt the learning environment for the rest of the students in the class—stealing learning time from every child.
The teacher couldn’t teach and the other students couldn’t learn.
What if the 3.3 million suspensions in 2006 were not from 3.3 million individual children because many might have been repeat offenders. It would be nice to know how many students were suspended more than once but I couldn’t find that information. For instance, what if only 500-thousand students or less earned those 3.3 million suspensions? If correct, that would mean less than 1% of the total public school students were actually suspended from school—some multiple times.
But what if the 3.3 million suspended students were counted as individuals and not multiple offenders. Then there’s another way to look at this large but insignificant number.
There were about 7.2 million teachers in the United States in 2009. Almost 3 million taught at the elementary and middle school level. The remainder included those teaching at the post secondary, secondary, preschool, kindergarten levels, special education and other teachers or instructors.
Taking the total number of teachers into account, if we divided the 3.3 million suspended students up evenly among the 7.2 million teachers, that equals 0.45 or less than half a student for each teacher for an entire school year. And even if we only counted the regular k – 12 teachers it would break about even—one suspended student each school year for each teacher. Source: U.S. Bureau of Labor Statistics as cited in the Statistical Abstract of the United States: 2011, Table 615 <https://www.census.gov/compendia/statab/>
And if all we do is count just the 3.7 million full-time-equivalent (FTE) elementary and secondary school teachers engaged in classroom instruction in fall 2012, then for every teacher there was 0.89% of a student suspended from a school for breaking rules and/or disrupting the educational environment so other students couldn’t learn. nces.ed.gov Do you know of any child who is only 0.89% of a child? Where did the missing 0.11% go—did that part of the suspended student stay in the classroom to cooperate and learn?
What about the 112k who were expelled from all of the public schools in 2006?
If we average that 112k, it becomes about 1.1 students for each school in the United States. Is that excessive requiring an act of Congress to control, and what happens to the Common Core standardized test scores that are being used to rank and fire teachers in only the public schools when teachers are forced to keep disruptive students in the classroom who literally rob learning time from all of our children—the 94% that don’t earn suspensions?
What about suspensions and expulsions in the other OECD nations, or is this something that Arne Duncan, Bill Gates and the other corporate education reformers don’t want America to know—because some OECD countries have higher rates of suspension and expulsion than the United States does?
The corporate reformers can avoid this information in their allegations of the US public schools, but they can’t hide it. The Stanford Graduate School of Education reported in January 2013 that Poor ranking on international tests misleading about U.S. performance and said, “There is an achievement gap between more and less disadvantaged students in every country; surprisingly, that gap is smaller in the United States than in similar post-industrial countries, and not much larger than in the very highest scoring countries. Achievement of U.S. disadvantaged students has been rising rapidly over time, while achievement of disadvantaged students in countries to which the United States is frequently unfavorably compared – Canada, Finland and Korea, for example – has been falling rapidly.”
In addition, while fewer than 3 percent of students in 13 countries—including Japan, Norway, and the United Kingdom—reported ever repeating a grade, more than 25 percent of students repeated at least once in France, Spain, Brazil, and a dozen others studied. The United States reported more than one in 10 students (10 percent) repeating a grade, higher than the OECD average, while the top-performing countries, Finland and Korea, do not allow grade retention. … The OECD found that both high rates of grade retention and transfer happened in countries in which a child’s socioeconomic status was more likely to predict that child’s academic performance. Education Week.org
What happens to teachers if the Department of Education and/or the U.S. Congress caves in to pressure from special interest groups—possibly funded by Bill Gates or the Walton family—and drafts legislation that takes away a teacher or school’s power to suspend or remove a student through expulsion—especially when teachers are being ranked and then fired based on the Common Core standardized test results of a teacher’s students?
If being ranked and fired by those test scores becomes a reality for every public school teacher, then every instructional and/or learning minute will become vitally important and forcing teachers to keep children who cause problems and disrupt the learning environment will cripple a teacher’s ability to teach.
Maybe that’s what President Obama, Arne Duncan, Bill Gates and the Walton family want to happen so they can turn our children over the corporations to brainwash.
In conclusion, if you are one of the critics of public education who thinks 3.3 million (6.1%) children suspended from the public schools in one school year is too many, then instead of passing laws restricting the public schools’ ability—because these laws will not impact the corporate Charter schools that also are not required to teach to the Common Core—to decide who gets suspended, consider looking at what causes those children to disrupt the classroom—for instance, poverty and single parents families, and do something about that instead of making a teacher’s job to teach more difficult by forcing them to keep those at-risk and difficult to teach children in the classroom. And if you think the corporate reform movement has the answer, think again.
Joseph Williams, a veteran journalist and former White House correspondent for Politico, reported, “Charter schools also lead their traditional counterparts in a more disturbing trend: the number of students who are suspended or expelled each year … charter schools are far more likely to suspend students for infractions such as dress code violations and insubordination toward teachers.”
In fact, if there are suspension restrictions imposed on the public schools, those same restrictions will not be imposed on the corporate Charters just like the Common Core agenda to rank and fire teachers is not found in private-sector Charters—proving that this latest manufactured crisis in public education is another ploy by the corporate reformers to destroy the public schools.
_____________________________________
Lloyd Lofthouse is a former U.S. Marine and Vietnam Veteran,
who taught in the public schools for thirty years (1975 – 2005).
Runner Up in Biography/Autobiography
2014 Florida Book Festival

Honorable Mentions in Biography/Autobiography
2014 Southern California Book Festival
2014 London Book Festival
His third book is Crazy is Normal, a classroom exposé, a memoir. “Lofthouse presents us with grungy classrooms, kids who don’t want to be in school, and the consequences of growing up in a hardscrabble world. While some parents support his efforts, many sabotage them—and isolated administrators make the work of Lofthouse and his peers even more difficult.” – Bruce Reeves
Lofthouse’s first novel was the award winning historical fiction My Splendid Concubine [3rd edition]. His second novel was the award winning thriller Running with the Enemy. His short story A Night at the “Well of Purity” was named a finalist of the 2007 Chicago Literary Awards. His wife is Anchee Min, the international, best-selling, award winning author of Red Azalea, a New York Times Notable Book of the Year (1992).
To follow this Blog via E-mail see upper right-hand column and click on “Sign me up!”
